Model visualization
When visualizing a model using the show API, there are a lot of layout options. In this notebook we will show how to edit the way that a visualization looks, and how to export it in various formats. There are also visualization features that are specific to schedulers, results and the simulator. These will be explored in the respective notebooks on these topics.
Note: This notebook does not render properly in the HTML docs.
Javascript visualization
Remember the car model from the introduction? You will notice that it does not have the same colors as it had in the introduction notebook. The reason for this is that in the introduction, we specified a different Layout.
[1]:
from stormvogel import *
vis = show(examples.create_car_mdp())
# vis = show(examples.create_car_mdp(), show_editor=True) # with layout editor
Basic editing
Let’s edit the layout! The first thing that you need to do is open the layout editor by adding show_editor = True to the call to show. A menu will open up with a lot of different sections that can be opened by clicking on them. First of all, let’s try to alter the colors of states and actions. Click on ‘states’ or ‘actions’ and then adjust ‘bg color’ by clicking on the box with a color. A color picker will open up. You will notice that there are a lot of different options, feel free to
play around with them and see the changes to the model in real time.
Dragging nodes
You can also change the position of nodes by selecting them in the displayed network, and moving them around. This does not require the editor, but your changes here can only be saved if you are using it.
Exploring
Go to ‘misc’, set ‘explore’ to True and press the ‘Reload’ button. Now you can explore the model. Clicking on a node reveals its successors.
Edit groups
In the model in the introduction notebook, states with different labels had different colors, but right now we only have a single group for states, and a single group for actions. You can change this by going to ‘edit_groups’. By default, there are two groups: one for states and one for actions.
Remove both of them from the list by pressing the cross next to them. Now press the reload button at the bottom, and you will see that ‘states’ and ‘actions’ are removed from the editing menu.
Now open ‘edit_groups’ again and press the empty box. It will give you some options that correspond to the labels of the states that are present. Select ‘green_light’, ‘red_light’ and ‘accident’. Press reload again. Now you can edit these groups and create a similar layout to the introduction notebook.
Saving layouts (including node positions)
It is always useful to save your layout so that it won’t be gone once you re-execute the cell. An easy way of doing this is by going to ‘saving’, and providing a path to store the json file that contains your layout. Then press ‘Save’. If you re-execute the cell, and go to saving, enter the same name, and press ‘Load’, your layout will be back. In practice, it is more useful to also be able to load a layout without having to go through the menu. You can do this easily by adding
layout=Layout("filename.json") the call to show.
Exporting visualizations
Visualizations in stormvogel are rendered to HTML. This means that you can also export them and embed them in other web pages. You can also export it to a vector image in svg or pdf format. The latter is easy to include in your latex projects by \includegraphics{export.pdf}.
Note: There are additional model visualization features for schedulers and results, but they will be explained in their respective notebooks.
[2]:
# vis = show(examples.create_car_mdp(), show_editor=True, layout=Layout("layouts/car.json"))
# This enables the layout in "layouts/car.json", and turns on the layout editor.
# Export the visualization in different formats:
# vis.export("html", "vis_html")
# vis.export("svg", "vis_svg")
# vis.export("pdf", "vis_pdf")
Advanced editing
If the layout editor does not provide a visualization option that you need, it is also possible to edit the layout manually. The following code shows you what the default layout looks like. Layout.layout is a dictionary that stores all the layout information. You could edit this directly, but this can get annoying because it is a nested dictionary. We provide a method set_value to make this easier. Alternatively, If you have a lot of options that you want to change at the same time, it
is probably easier to overwrite Layout.layout directly.
Try outcommenting the third line in the next cell, and see the changes. under “groups”. Then see the changes in the model by re-executing the final cell.
The structure of the layout is derived from the vis.js library (that is also used to display the models). There are many other options that can be changed but which are not in the layout editor. For more information, we refer to the vis.js documentation.
[3]:
my_layout = layout.DEFAULT()
my_layout.layout["groups"]["states"] = {}
my_layout.set_value(["groups", "states", "color", "background"], "orange")
my_layout.layout
[3]:
{'__fake_macros': {'__group_macro': {'borderWidth': 1,
'color': {'background': 'white',
'border': 'black',
'highlight': {'background': 'white', 'border': 'red'}},
'shape': 'ellipse',
'mass': 1,
'font': {'color': 'black', 'size': 14}}},
'edit_groups': {'groups': ['states', 'actions']},
'groups': {'actions': {'shape': 'box', 'color': {'background': 'lightblue'}},
'scheduled_actions': {'shape': 'box',
'color': {'background': 'pink', 'border': 'red'}},
'states': {'color': {'background': 'orange'}}},
'reload_button': False,
'edges': {'arrows': 'to',
'font': {'color': 'black',
'size': 14,
'strokeColor': 'white',
'strokeWidth': 2},
'color': {'color': 'black'},
'width': 1},
'numbers': {'visible': True,
'fractions': True,
'digits': 5,
'denominator_limit': 1000},
'results': {'show_results': True,
'result_symbol': '☆',
'result_colors': True,
'min_result_color': '#ffffff',
'max_result_color': '#ff0000'},
'state_properties': {'show_ids': False,
'show_rewards': True,
'reward_symbol': '€',
'show_zero_rewards': True,
'show_observations': True,
'observation_symbol': 'ʘ'},
'layout': {'randomSeed': 5},
'misc': {'enable_physics': True,
'width': 800,
'height': 600,
'explore': False},
'saving': {'relative_path': True,
'filename': 'layouts/NAME.json',
'save_button': False,
'load_button': False},
'positions': {},
'physics': True,
'autoResize': True}
[4]:
vis = show(examples.create_car_mdp(), layout=my_layout)
Javascript injection
If you want to customize the visualization even more, you can modify the source code, or you can use Javascript injection from a notebook. Yous can always use IPython.display to execute JavaScript code, and f"{vis.network_wrapper}.network" to retrieve the vis.js Network object. Also see html_generation.py and the documentation of vis.js.
Here is a small example of javascript injection that destroys the network.
[5]:
# import IPython.display as ipd
# ipd.display(ipd.Javascript(
# f"""{vis.network_wrapper}.network.destroy()"""))
Positioning algorithms
We can use positioning algorithms from networkx to set the positions of nodes in the visualization, or create our own. Check out the networkx documentation for a list of positioning algorithms.
[6]:
from stormvogel import *
import networkx as nx
def positioning(G):
# return nx.bfs_layout(G, start=0) # Good for DAGs, we have to specify start=0
# return nx.kamada_kawai_layout(G) # Good overal
return nx.circular_layout(G)
vis = show(
examples.create_car_mdp(),
pos_function=positioning,
pos_function_scaling=300,
layout=Layout("layouts/car.json"),
)
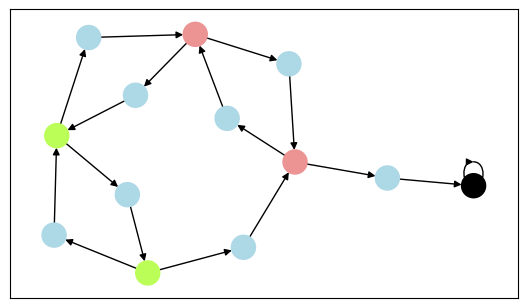
Matplotlib visualization
Alternatively, we can also use matplotlib to display our models if we tell stormvogel to use “mpl” as the engine. The support for this is more limited.
[7]:
vis = show(examples.create_car_mdp(), engine="mpl", layout=Layout("layouts/car.json"))